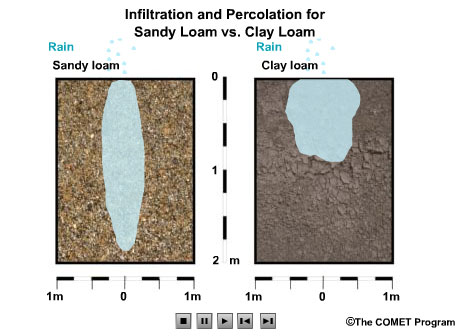
video-Visualizing Soil Properties: Water Infiltration
OSU Extension – Containers and Media for the Nursery
Growing Media for Container Production in a Greenhouse or Nursery
Media Chemical Properties
| Table 1. Typical ranges based on a saturated media extract (SME) analysis. | |
| Parameter | Typical Range |
| pH | 5.0-6.5 |
| EC | . .500-3,000 umho/cm |
| NO3–N | . .40- 00 ppm |
| P | . .5-50 ppm |
| K | . .50- 00 ppm |
| Ca | . .30-1 0 ppm |
| Mg . . . . . . . . . . . . . . . | 0-75 ppm |
| Na | . .4-80 ppm |
Media pH is a critical issue because it plays a major role in determining the availability of many nutrients A common problem occurs in organic-based mixes when the pH falls below 5 0 Below this pH, the availability of Zn and Mn increases dramatically and often results in foliar toxicities from these elements While aluminum toxicity is recognized as a common concern in mineral soils at a low pH, this is usually not a problem in organic-based mixes
Cation Exchange Capacity (CEC)
CEC can vary widely depending on the type of component For example, perlite (1 5 meq/100 gm) and sand have very low CEC values relative to peat and vermiculite (125 meq/100 gm) components Some growers have started to use small volumes (2 to 15 percent) of clay-type amendments (e g , zeolites) in their soilless media These clay amendments may increase a medium’s nutrient retention and improve its physical properties It is important to understand which components have a higher CEC to help develop fertility programs and troubleshoot certain nutrient disorders
Soluble Salts
Similar to media pH, the level of soluble salts that may be tolerated is crop specific The extent of injury will be determined by the plant type, stage in production, longevity of exposure, concentration of salt and irriga- tion practices In general terms, fresh media without fertilizers should have a pour-through EC of less than 750 umho/cm The addition of fertilizer may mean this value is much higher and normal for a particular crop at a specific stage of production
Adjusting Media pH
Raising Media pH
In most cases, nursery and greenhouse growers need to be concerned about raising the media pH since most of the organic media components are acidic The most commonly used material is either calcitic (CaCO3) or dolomitic limestone (mixture of CaCO3 and MgCO3) The amount of lime required will depend on the starting pH, the desired pH, the particle size of the limestone (i e , small particles faster acting than large ones), the type of media and the alkalinity of irrigation water used In general, lime rates generally fall in a range between 5 and
15 lbs/yd3 with rates below 8 pounds most common Calcitic or dolomitic limestone is most reactive when incorporated into the media prior to planting Note that many of the pelletized granular limestone materials are actually fine powders that have been glued together with a binder When these granules or prills are exposed to water, they fall apart into a fine powder These fine powders are faster acting than coarser prills but may also wash out of the bottom
of the pot if the media is coarse textured It is absolutely critical that growers know the starting pH of their mix and then monitor the pH over time to see how their fertilizer and irrigation water influence media pH
Other liming materials include calcium oxide (CaO; quick or burned lime, which is very reactive, caustic and more expensive), hydrated lime [Ca(OH)2; also fast acting, caustic and more expensive], marl, egg or oyster shells and wood ash
Greenhouse growers may wish to try one of the following if the pH needs to be raised once the plants are in production The first option is to apply a flow- able limestone drench Start with a 1 quart per
100 gallons rate Avoid getting this mixture on the foliage if possible The second option involves injecting potassium bicarbonate into the irrigation water Continued use of this method may require a grower to switch to a lower potassium source fertilizer
If you are using liquid fertilization (fertigation), you can increase your media pH by switching from an acid-based fertilizer (high percentage of nitrogen in the ammoniacal form) to basic fertilizers that are based on a higher percentage of the nitrogen in the nitrate form
Lowering Media pH
Only rarely do growers using organic mixes express interest in lowering the media pH Generally, the problem develops from using an irrigation water source that has high alkalinity (>100 ppm CaCO3) In those cases, growers typically choose to install an acid injector Others methods are selected if individual blocks of plants require a lower media pH
Materials such as elemental sulfur, ammonium sulfate and ferrous sulfate have all been used Caution must be used when considering using ammo- nium sulfate and ferrous sulfate as you need to account for the nitrogen and iron that accompanies these materials Aluminum sulfate is also an option but is used only for reducing pH around floristhydrangeas (Hydrangea macrophylla) Growers can also affect media pH by selecting specific forms of nitrogen The use of high ammoniacal-nitrogen based fertilizers can lower the media pH over time
Rate recommendations take into consideration the change in pH and type of media and may be obtained from grower manuals or your Cooperative Extension Service
Managing Substrate EC
Electrical conductivity (EC) is a good estimate for the total soluble salts in a media EC does not provide details on the type or amount of individual salts present High ECs can contribute to poor shoot and root growth The first objective is to determine the source for the elevated salts Typically, this will be from the irrigation water source or from the amount or type of fertilizer used Once the source has been identified, you will want to determine if you can reduce or eliminate that source Media salt concentra- tions are directly impacted by what is called the leaching fraction This value represents the percentage of water that leaves a container relative to what is applied High salt conditions can be effec- tively managed by keeping the leaching fraction high (20 to 30 percent) and not allowing pots to dry out The danger in keeping pots wet is that it can contribute to secondary problems with root rot organ- isms (Consult FSA 0 1, Irrigation Water for Greenhouses and Nurseries, for more information on irrigation water quality )
Disinfecting Media
Three methods are primarily considered for sterilization of media Sterilized media is common in plant propagation and greenhouse operations but is not usually considered in an outdoor nursery simply based on the volume of media required and the bene- fits derived Remember that certain amendments
(e g , perlite, vermiculite) are sterile and, therefore, do not require sterilization Composted pine bark and peat contain populations of suppressive microbes that might be eliminated by sterilization techniques
Steam Pasteurization
Steam pasteurization is commonly found in greenhouse or ground bed production The general recommendation is the exposure to steam (212°F) for 30 to 45 minutes The piles should be small enough so all sections reach at least 180°F Piles too big may take too long to achieve uniform heating You must have an appropriate thermometer handy to effectively monitor the temperature at various places in the pile or bed Over-steaming is possible and should be avoided since this kills beneficial organisms and may cause the release of toxic substances, especially when organic components are involved
An alternative pasteurization process, aerated steam, involves blowing a mixture of steam and air through the media Aerated steam (140° to 175°F) uses less energy and fewer beneficial organisms are likely to be harmed Steam pasteurization SHOULD NOT be used on media that has had slow-release fertilizer blended into it!
Chemical Fumigation
Chemical fumigation is usually limited to ground beds in cut flower production The primary chemicals used were methyl bromide and vapam Methyl bromide uses were phased out in 2005 Consult your Cooperative Extension Service for current recommendations
Solarization
Solarization is rarely used because the process may take up to one month even under summer condi- tions requiring tremendous planning for future media needs Solarization is accomplished by spreading moist media to a depth of 6 to 10 inches on a clean surface The pile or row is then covered with clear plastic sheets with the edges sealed to the surface to prevent the loss of heat and moisture
Media Physical Properties
Media physical properties may be determined using simple laboratory methods Media samples can be analyzed by commercial laboratories, or you can make the physical measurements yourself using simple tools Procedures for determining physical properties of horticultural substrates are available at https://projects.ncsu.edu/project/ hortsublab/pdf/porometer_manual.pdf.
4 Ways to Calculate Porosity – wikiHow
Weight (Bulk Density)
Media weight is kind of a double-edged sword Ideally growers would like a heavy mix when containers are on the ground in an outdoor nursery to minimize blow-over, but during plant movement and shipping, a lightweight mix is desired Weight or bulk density is usually expressed as lbs/ft3 and reported on a dry basis For outdoor container nurseries, dry bulk density of media might range between 12 to 24 lbs/ft3 (wet bulk density of 70 and 90 lbs/ft3) A nursery media that uses a significant percentage of mineral soil will have a dry bulk density of 40 to 50 ft3 For a greenhouse media, the dry bulk density will be lower and in the range of 8 to 18 lbs/ft3 Air-Filled Porosity
When we fill a container with media, the total volume of space in that container is filled with two things: the solid media components and the spaces or voids between all of the solids (Figure 1) Ideally the total volume of empty pores should be in the range of 50 to 70 percent This is referred to as total porosity The remaining container volume would be filled with the solid growing media (i e , 30 to 50 percent) The total porosity of a media is further composed of two parts: air and water Both components are critical for good plant growth, but not enough of either can limit growth
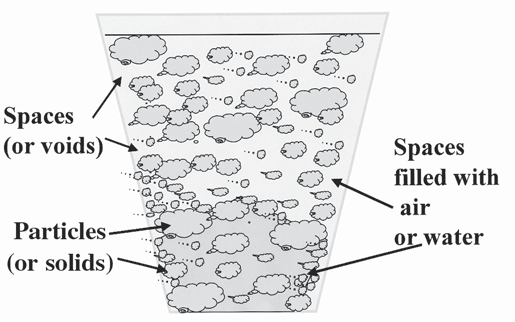
Figure 1. The container is filled with the solid media components and the spaces or voids between all of the solids.
For one quart and larger containers the air-filled porosity (percentage of pores filled with air) typically ranges from 10 to 20 percent by volume For a 280- plug tray, an acceptable range in air-filled porosity may fall in the range of 3 to 6 percent by volume Obviously, the container volume influences the inter- pretation of the acceptable values The higher the percentage of air-filled porosity, the more frequently watering will be required Propagation media where aeration and drainage are critical may have an air- filled porosity in the range of 15 to 25 percent
lumetric Moisture Content (sometimes referred to as Water-Holding Capacity)
As described above, the bulk volume of a container will be filled with either solids or pores These pores or voids are then either filled with water or air A typical range in values for the volumetric moisture content (percentage of the pores filled with water after allowing for free drainage) will be between 45 and 65 percent by volume Volumetric moisture content (VMC) gives a grower some indica- tion of how wet or how dry a media will be Sphagnum peat moss that retains water quite well typically has a VMC of 60 percent, while coarse sand, which does not hold water, might have a VMC of
25 percent As was the case with air-filled porosity, the actual values for VMC need to be interpreted relative to the height of the growing container For example, an acceptable VMC for a 6-inch container might be 45 percent, while for a plug tray 68 percent would be a more typical value The effect of media height on the saturated zone is illustrated in
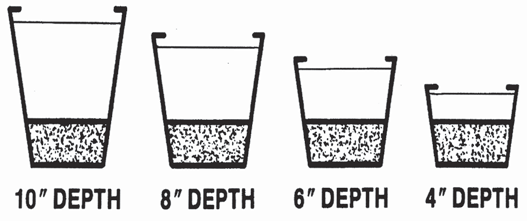
Figure . Containers contain the same media. Notice, saturated zone (textured area at bottom of each container) is the same regardless of the container height.
All of these physical parameters can be determined in-house with the aid of a scale or balance The measurements can also be determined by an outside commercial laboratory or with the help of the Cooperative Extension Service

Graph-Electrical conductivity for various soil substrates
Containers and Media for the Nursery
Porosity: Measuring Pore Space
Pore space is expressed in terms of porosity, which is the percentage of pore space volume for a given substrate volume. You can determine the porosity, air space, and water space in your substrate by following the five steps below.
- Determine the volume of the pot used to grow plants. You can usually obtain this from the manufacturer.
- Add a water-tight liner (such as a polyethylene wrap) to the outer bottom of the pot. Tape the liner to the pot to prevent any material from draining through the holes.
- Pour the substrate to the top of the pot. Make sure to compact the substrate as you would normally do during production. At this point, the substrate volume is equal to the volume of pot.
- Add water to the top of the substrate, and carefully monitor how much you add. You want to add water until you completely saturate the substrate — that is, when you start to see a shiny layer of water over the substrate. Cover the pot with a lid and keep it aside for an hour. After one hour, check if you need to add a little more water to saturate the substrate. The total volume of water that you added to saturate the substrate
is equivalent to the total pore space volume.
Use this equation to determine porosity:
Porosity (%) = 100 x Volume of water added to fill Pot with substrate / Volume of Pot
Next, place the pot in a water-tight container and make holes at the bottom of the liner you added in step one. Your goal is to drain the water and collect it in the container. Let the pot drain for 10 to 15 minutes so the water can completely drain out. Then, measure the drained volume of water. This volume is equivalent to the air space volume in the substrate.
Use this equation to determine air space:
Air space = 100 x Volume of water drained / Volume of Pot
The water that is left in the substrate after it drains is the water space (also called maximum water-
holding capacity or container capacity). Once you’ve determined air space, you can determine water space with this equation:
Water space (%) = 100 – Air space(%)
Table 1. The following table provides information about the fractional volume of pore space, air space, and water space in two soilless substrates:
Note AFP has different definitions- some have air + water + solid -100
| Component | Peat + Bark + Perlite + Vermiculite (P-B-P-V) | Peat + Perlite (P-P) |
| Solids (%) | 40.9 | 38.6 |
| Porosity (%) | 59.1 | 61.4 |
| Water space (as % total pore space) | 72 | 62 |
| Air space (as % total pore space) | 28 | 38 |
Soil Electrical Conductivity
Soil electrical conductivity (EC) measures the ability of soil water to carry electrical current. Electrical conductivity is an electrolytic process that takes place principally through water-filled pores. Cations (Ca2+, Mg2+, K+, Na+, and NH +) and anions (SO 2-, Cl-, NO -, and HCO -) from have higher EC than sandy outwash or alluvial deposits. Saline (ECe ≥ 4 dS/m) and sodic (sodium absorption ratio ≥ 13) soils are characterized by high EC. Scientific literature reported a relationship between EC values measured with commercial sensors and depths to claypan, bedrock, and fragipan. Microtopographic depressions in agricultural fields typically are wetter and accumulate salts dissolved in soil water carry electrical charges and conduct the electrical current. Consequently, the concentration of ions determines the EC of soils. In agriculture, EC has been used principally as a measure of soil salinity (table 1); however, in non-saline soils, EC can be an estimate of other soil properties, such as soil moisture and soil depth. EC is expressed in deciSiemens per meter (dS/m).
Factors Affecting
Inherent – Factors influencing the electrical conductivity of soils include the amount and type of soluble salts in solution, porosity, soil texture (especially clay content and mineralogy), soil moisture, and soil temperature. High levels of precipitation can flush soluble salts out of the soil and reduce EC. Conversely, in arid soils (with low levels of precipitation), soluble salts are more likely to accumulate in soil profiles resulting in high EC. Electrical conductivity decreases sharply when the temperature of soil water is below the freezing point (EC decreases about 2.2% per degree centigrade due to increased viscosity of water and decreased mobility of ions). In general, EC increases as clay content increases. Soils with clay dominated by high cation-exchange capacity (CEC) clay minerals (e.g., smectite) have higher EC than those with clay dominated by low CEC clay minerals (e.g., kaolinite). Arid soils with high content of soluble salt and exchangeable sodium generally exhibit extremely high EC. In soils where the water table is high and saline, water will rise by capillarity and increase salt concentration and EC in the soil surface layers.
It is generally accepted that the higher the porosity (the higher the soil moisture content), the greater the ability of soil to conduct electrical currents; that is, other properties being similar, the wetter the soil the higher the EC. Soil parent materials contribute to EC variability. Granites have lower EC than marine shales and clayey lacustrine deposits organic matter and nutrients and therefore have higher EC than surrounding higher lying, better drained areas.
Dynamic – Mineral soils enriched in organic matter, or with chemical fertilizers (e.g., NH4OH) have higher CEC than non-enriched soils, because OM improves soil water holding capacity, and synthetic fertilizers augment salt content. Continuous application of municipal wastes on soil can increase soil EC in some cases. Electrical
conductivity has been used to infer the relative concentration, extent, and movement of animal wastes in soils. Because of its sensitivity to soluble salts, EC is an effective measure for assessing the contamination of surface and ground water. Although EC does not provide a direct measurement of specific ions or compounds, it has been correlated with concentrations of potassium, sodium, chloride, sulfate, ammonia, and nitrate in soils. Poor water infiltration can lead to poor drainage, waterlogging, and increased EC.
Relationship to Soil Function
Soil EC does not directly affect plant growth but has been used as an indirect indicator of the amount of nutrients available for plant uptake and salinity levels. EC has been used as a surrogate measure of salt concentration, organic
Table 1. Classes of salinity and EC (1 dS/m = 1 mmhos/cm; adapted from NRCS Soil Survey Handbook)
| EC (dS/m) | Salinity Class |
| 0 < 2 | Non-saline |
| 2 < 4 | Very slightly saline |
| 4 < 8 | Slightly saline |
| 8 < 16 | Moderately saline |
| ≥ 16 | Strongly saline |
matter, cation-exchange capacity, soil texture, soil thickness, nutrients (e.g., nitrate), water-holding capacity, and drainage conditions. In site-specific management and high-intensity soil surveys, EC is used to partition units of management, differentiate soil types, and predict soil fertility and crop yields. For example, farmers can use EC maps to apply different management strategies (e.g., N fertilizers) to sections of a field that have different types of soil. In some management units, high EC has been associated with high levels of nitrate and other selected soil nutrients (P, K, Ca, Mg, Mn, Zn, and Cu).
Most microorganisms are sensitive to salt (high EC). Actinomycetes and fungi are less sensitive than bacteria, except for halophyte (salt-tolerant) bacteria. Microbial processes, including respiration and nitrification, decline as EC increases (table 2).
Problems with Poor Soil EC Levels
High EC can serve as an indication of salinity (EC > 4 dS/m) problems, which impede crop growth (inability to absorb water even when present) and microbial activity (tables 2 and 3). Soils with high EC resulting from a high concentration of sodium generally have poor structure and drainage, and sodium becomes toxic to plants.
Improving Soil EC
Effective irrigation practices, which wash soluble salts out of soil and beyond the rooting depth, can decrease EC. Excessive irrigation and waterlogging should be avoided since a rising water table may bring soluble salts into the root zone. In arid climates, plant residue and mulch help soils to remain wetter and thus allow seasonal precipitation and irrigation to be more effective in leaching salts from the surface. To avoid the adverse effects of high EC (salinity) in irrigation water, the leaching requirement must be calculated for each crop. Leaching requirement is the fraction of water needed to flush excessive salt below the root zone, that is, the amount of additional water required to maintain a target salinity level. Adding organic matter,
such as manure and compost, increases EC by adding cations and anions and improving the water-holding capacity. In some cases, a combination of irrigation and drainage is necessary to lower salt concentration and EC. An EC water (ECw) ≤ 0.75 dS/m is considered good for irrigation water. Beyond this value, leaching or a combination of leaching and drainage will be necessary if the water is used.
Measuring Soil EC
The EC pocket meter is used to take measurements in the field. The method is described in the Soil Quality Test Kit Guide. Always calibrate the EC meter before use.
The pocket meter can be augmented by a probe that is placed directly into the soil to measure subsoil EC and NO – and make other estimates. NRCS soil scientists and agronomists use electromagnetic induction meters, not pocket EC meters, to map spatial variability of EC and associated soil properties at field scales. Special sensors are used for EC mapping for precision agriculture.
| Table 2. Influence of soil EC on microbial process in soils amended with NaCl or nitrate (adapted from Smith and Doran, 1996) | ||||
| Microbial process | Salt added | EC Range (dS/m) | Relative Decrease (%) | Threshold EC (1:1) |
| Respiration | NaCl | 0.7 – 2.8 | 17 – 47 | 0.7 |
| Decomposition | NaCl + alfalfa | 0.7 – 2.9 | 2 – 25 | 0.7 |
| Nitrification | soil + alfalfa | 0.7 – 2.9 | 10 – 37 | 0.7 |
| Denitrification | NO3-N | 1 – 1.8 | 32 – 88 | 1 |
| Table 3. Salt tolerance of crops and yield decrease beyond EC threshold (adapted from Smith and Doran, 1996) | ||
| Crop species | Threshold EC 1:1 (dS/m)* | Percent yield decrease per unit EC beyond threshold EC |
| Alfalfa | 1.1 – 1.4 | 7.3 |
| Barley | 4.5 – 5.7 | 5.0 |
| Cotton | 4.3 – 5.5 | 5.2 |
| Peanut | 1.4 – 1.8 | 29 |
| Potato | 1.0 – 1.2 | 12 |
| Rice | 1.7 – 2.1 | 12 |
| Soybean | 2.8 – 3.6 | 20 |
| Tomato | 1.4 – 1.8 | 9.9 |
| Wheat | 3.9 – 5.0 | 7.1 |
| * Electrical conductivity of a 1:1 soil/water mixture relative to that of a saturated paste extract |
==========================================================
A Nursery Friendly Method for Measuring Air Filled Porosity of Container Substrates
Bilderback-NC State
- Porometer construction: Measuring air-filled porosity requires an apparatus called a porometer. Therefore, the first step is to construct porometers
- Pre-moistening Substrate to Be Tested. Pre-moistening 12–24 h before testing is critical for achieving uniform and consistent results.
- Packing Porometers with Substrate: After removing the plastic carton tops, individually weigh each porometer and record the weight. The weight of the plastic carton is subtracted from filled cartons as a “tare” weight to provide an accurate mass of substrate in each porometer. Next, overfill each porometer with potting substrate; tap each porometer firmly 3–5 times on a table or bench to eliminate air pockets and establish a bulk density
- Saturate Substrate in Porometers: After packing, porometers are set upright in a vessel large enough for all of the test porometers to stand erect and tall enough to add water to the top of the porometers
- Collecting and Measuring Drainage: Saturation of each porometer can be observed when water is seen at the surface of the substrate. Drainage from each porometer must be measured individually. This step may require practice. Fingers are used to prevent leaking from the drainage holes while the porometer is lifted from the saturation vessel and a pan is quickly placed under the drain holes. Porometers can be balanced on supports placed in the bottom of the drainage pan and allowed to fully drain. After draining has stopped, the drained volume is measured and recorded for each porometer
- Calculating air filled porosity: The drainage volume is divided by the total volume for each porometer to determine a percent air-filled porosity (Table 1). Air-filled porosity measurements are added and divided by the number of porometers to obtain an average AFP for each test substrate. Changes in air filled porosity during a growing season or over a production cycle can be measured by placing porometers packed with substrate in containers which are set in nursery growing beds. Decomposition shrinkage should be measured and marked from the top of the porometer. The volume of the porometer marked at the surface of the substrate would be used as the new total volume and calculations followed as described above. If the important steps for pre- moistening samples and for packing to match the weight of each replicate sample in porometers are followed, consistent results can be accomplished.
Monitoring electrical conductivity in soils and growing media
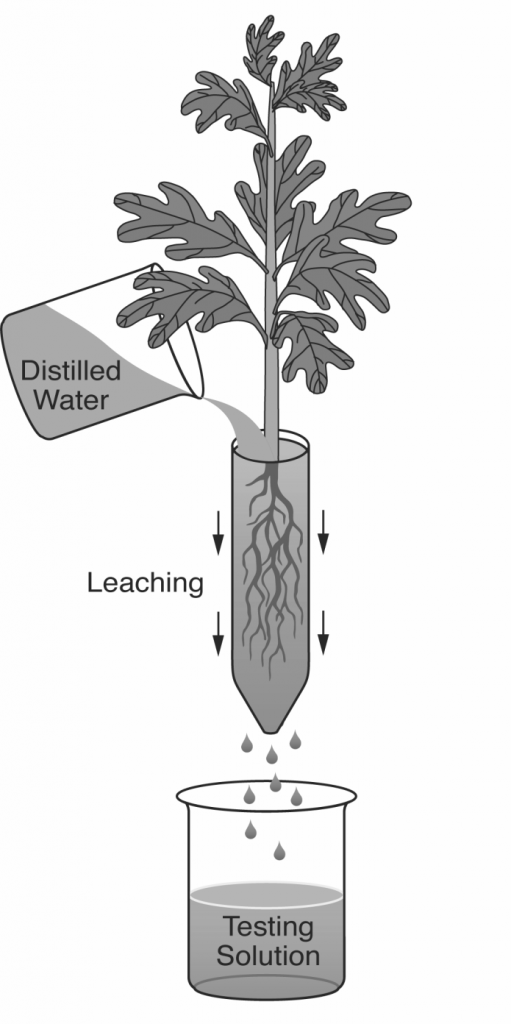
What is EC? EC is a measure of the salinity (total salt level) of an aqueous solution. Pure, distilled water is a perfect insulator and it’s only because of dissolved ions that it can conduct electricity at all (Figure 1A). An EC meter measures the electrical charge carried by the ions that are dissolved in a solution— the more concentrated the ions, the higher the reading.
In nurseries, dissolved ions come from two sources (Figure 1B). First, all irrigation water contains some salt ions as rain water trickles through the soil and rocks.
The amount of the “background” salinity is a function of the local geology and climate. Soils and parent material have a major effect. Soils derived from marine sediments will contain high levels of sodium, chloride and sometimes boron. Water running through calcareous rocks or soils picks up calcium, magnesium and bicarbonate ions. Irrigation water from dry climates will have higher salinity than water from a humid climate. This only makes sense because, when water evaporates, the dissolved salts are left behind and the remaining solution would have a higher EC reading.
The second source of salinity in soils or growing media is from added fertilizers (Figure 1B). The release of salts varies considerably depending on how you are fertilizing. When fertigating, the soluble fertilizer that you inject into the irrigation water can be measured immediately. In fact, the best way to check the accuracy of your injector is to measure the EC of the applied fertigation solution. If you are incorporating controlled-release fertilizers into the soil or growing medium, however, then the salts are released according to fertilizer coating, water levels, and temperature. Most solid organic fertilizers release their nutrients very slowly and are less temperature or moisture dependent. Liquid organics release nutrients more rapidly but still much slower than soluble fertilizers.
EC Units. The physics and politics of this subject are complicated but think of it this way. We’re measuring electrical conductance which is the inverse of resistance. The unit of resistance is an ohm, and just to be cute, they call the unit of conductance a mho (pronounced “mow”), which is ohm spelled backwards. The most commonly used EC units in horticulture are micromhos per centimeter (µhos/cm), and the SI units of microsiemens per centimeter (µS/cm) which are equivalent. Because electron activity is strongly dependent on temperature, all EC measurement must be adjusted to a standard temperature of 77 °F (25 °C
Saturated Media Extract (SME). This technique is the laboratory standard that is used by commercial soil and water testing laboratories. If you are interested in absolute EC values, this is the only choice. The SME method uses saturation as the standard soil or media
The use of controlled-release fertilizers (CRF) has complicated the measurement of EC. Because the prills are very fragile, even collecting a sample or squeezing it can damage them. Broken prills will release all their fertilizer salts at once and artificially elevate the EC reading. Thus, some of the EC monitoring procedures should not be used when incorporating CRF
Pour-Through. This is a relatively new technique for measuring EC in containers, and works for all container types except for miniplugs where their short height stops the media solution from freely draining. It would also be impractical for very large containers which are difficult to move (Table 1). The pour-through process consists of 2 steps (Figure 4). First, medium in a container is progressively irrigated until saturated, and then left to stand for about 2 hours. Or, just do the procedure 2 hours after irrigation. Next, pour a volume of distilled water onto the media surface to produce about 100 ml of leachate. Of course, this depends on container volume and type of growing media. Make sure and apply the water slowly enough that it doesn’t run off and down the insides of the container. The idea is to have the applied water force out the solution surrounding the roots. The pour-through technique is ideal for growing media with controlled-release fertilizers because the prills are not squeezed or otherwise damaged (Table 1). Therefore, this method is ideal for outdoor growing compounds where controlled release fertilizers are the standard.
Figure 4 – The pour-through technique works for all containers except miniplugs and larges sizes, and is ideal when using controlled-release fertilizers
video-Pour Through Method for pH and EC
video-Hanna Lab – Set Up and Calibrate the Hanna Instruments pH, EC, TDS Combo Tester HI98129
video-Substrate Water Holding Capacity
===================================
Dry Bulk Density:
ρb = Ms / Vt
Where, ρb = Dry Bulk Density, Ms = Mass of Soil Vt = Volume
Wet Bulk Density:
Pt = (Msolid+Mliquid)/Vtotal
Where, Pt = Wet Bulk Density Msolid = Mass of Solids Mliquid = Mass of Liquid Vtotal = Total Volume
Moisture Content :
w = (Mw / Ms) * 100
Where, w = Moisture Content Mw = Mass of Water in Soil Ms = Dry Mass of Soil
Soil void ratio (e) is the ratio of the volume of voids to the volume of solids:
e = (V_v) / (V_s)
Where V_v is the volume of the voids (empty or filled with fluid), and V_s is the volume of solids.
soil porosity (n) is defined as the ratio of the volume of voids to the total volume of the soil. The posoity and the void ratio are inter-related as follows:
e = n /(1-n) , and n = e / (1+e)
The value of void ratio depends on the consistence and packing of the soil. It is directly affacted by compaction. Some typical values of void ratio for different soils are given below:
| Description | USCS | Void ratio [-] | Reference | ||
| min | max | Specific value | |||
| Well graded gravel, sandy gravel, with little or no fines | GW | 0.26 | 0.46 | [1], | |
| Poorly graded gravel, sandy gravel, with little or no fines | GP | 0.26 | 0.46 | [1], | |
| Silty gravels, silty sandy gravels | GM | 0.18 | 0.28 | [1], | |
| Gravel | (GW-GP) | 0.30 | 0.60 | [2], | |
| Clayey gravels, clayey sandy gravels | GC | 0.21 | 0.37 | [1], | |
| Glatial till, very mixed grained | (GC) | – | – | 0.25 | [4 cited in 5] |
| Well graded sands, gravelly sands, with little or no fines | SW | 0.29 | 0.74 | [1], [2], | |
| Coarse sand | (SW) | 0.35 | 0.75 | [2], | |
| Fine sand | (SW) | 0.40 | 0.85 | [2], | |
| Poorly graded sands, gravelly sands, with little or no fines | SP | 0.30 | 0.75 | [1], [2], | |
| Silty sands | SM | 0.33 | 0.98 | [1], [2], | |
| Clayey sands | SC | 0.17 | 0.59 | [1], | |
| Inorganic silts, silty or clayey fine sands, with slight plasticity | ML | 0.26 | 1.28 | [1], | |
| Uniform inorganic silt | (ML) | 0.40 | 1.10 | [3], | |
| Inorganic clays, silty clays, sandy clays of low plasticity | CL | 0.41 | 0.69 | [1], | |
| Organic silts and organic silty clays of low plasticity | OL | 0.74 | 2.26 | [1], [3], | |
| Silty or sandy clay | (CL-OL) | 0.25 | 1.80 | [3], | |
| Inorganic silts of high plasticity | MH | 1.14 | 2.10 | [1], | |
| Inorganic clays of high plasticity | CH | 0.63 | 1.45 | [1], | |
| Soft glacial clay | – | – | – | 1.20 | [4 cited in 5] |
| Stiff glacial clay | – | – | – | 0.60 | [4 cited in 5] |
| Organic clays of high plasticity | OH | 1.06 | 3.34 | [1], [3], | |
| Soft slightly organic clay | (OH-OL) | – | – | 1.90 | [4] cited in [5] |
| Peat and other highly organic soils | Pt | – | – | [4 cited in 5] | |
| soft very organic clay | (Pt) | – | – | 3.00 | [4] cited in [5] |
Factors Affecting Porosity of Soil:
Wide difference in the total pore space of various soils occurs depending upon the following several factors:
(i) Soil Structure:
A soil having granular and crumb structure contains more pore spaces than that of prismatic and platy soil structure. So well aggregated soil structure has greater pore space as compared to structure less or single grain soil.
(ii) Soil Texture:
In sandy soils the total pore space is small whereas in fine textured clay and clayey loam soils total pore space is high and there is a possibility of more granulation in clay soils.
(iii) Arrangement of Soil Particles:
When the sphere like particles is arrangement in columnar form (i.e. one after another on the surface forming column like shape) it gives the most open packing system resulting very low amount of pore spaces. When such particles are arranged in the pyramidal form it gives the most close packing system resulting high amount of pore spaces.
(iv) Organic Matter:
Soil containing high organic matter possesses high porosity because of well aggregate formation.
(v) Macro-Organisms:
Macro-organisms like earthworm, rodents, and insects etc. increase macro-pores in the soil.
(vi) Depth of Soil:
With the increase in depth of soil, the porosity will decrease because of compactness in the sub-soil.
(vii) Cropping:
Intensive crop cultivation tends to lower the porosity of soil as compared to fallow soils. The decrease in porosity may be due to reduction in organic matter content.
(viii) Puddling:
Due to puddling under sufficient soil moisture, the soil surface layer is made dense and compact. Eventually, the porosity of this surface soil is reduced by the infiltration of muddy surface materials.
=============
Although it may seem counter-intuitive, the small pore spaces of clay add up to more total void space than the fewer number of large pore spaces in sand. Consequently, in light rain or slow snowmelt, clay may be able to hold more water than sand.
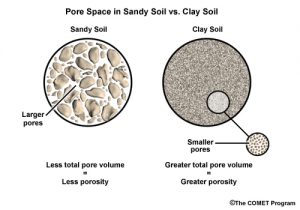
However, water drains from clay soil more slowly than from sandy soils. So in successive rain events, clay soils may remain saturated between storms and therefore produce more runoff in the later rain events.